How to pick a projection for a map?
When you choose to plot trajectories on a map, you have to make a choice concerning how to represent points at the surface of a sphere (more precisely, an oblate spheroid) on a 2D plane. This transformation is called a projection.
The choice of the right projection depends on the data. The most basic
projection (sometimes wrongly referred to as no projection) is the
PlateCarree(), when you plot latitude on the y-axis and longitude on
the x-axis. The famous Mercator() projection distorts the latitude
so as lines with constant bearing appear as straight lines. Conformal
projections are also convenient when plotting smaller areas (countries)
as they preserve distances (locally).
Many countries define official projections to produce maps of their
territory. In general, they fall either in the conformal or in the
Transverse Mercator category. Lambert93() projection is defined over
France, GaussKruger() over Germany, Amersfoort() over the
Netherlands, OSGB() over the British Islands, etc.
The cartes library builds on top of cartopy and tries to provide as many reference projections as possible, to use with Matplotlib or Altair.
Note
Read more about how cartes addresses projections
Tip
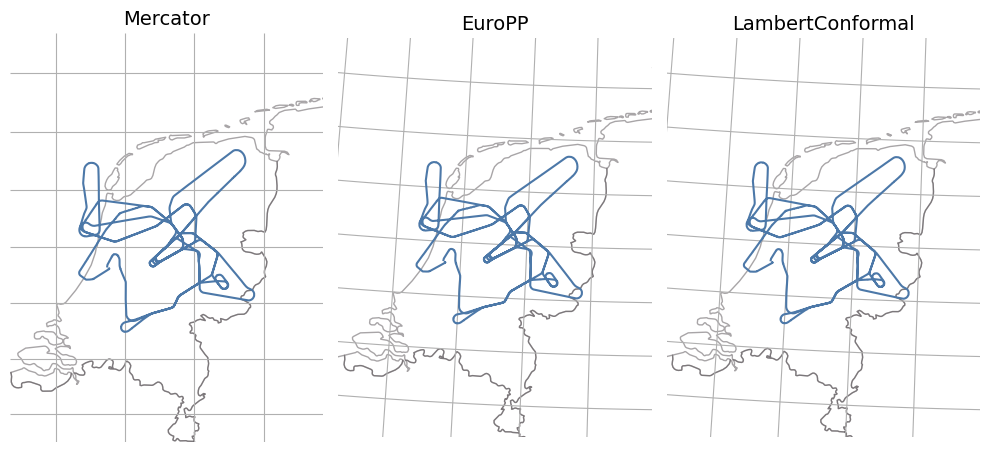
If you are happy to be projection illiterate, can’t find the slight
differences in the plots below, pick a Mercator() projection. When
plotting trajectories over Western Europe, EuroPP() is a decent choice.
Example with Matplotlib
import matplotlib.pyplot as plt

from cartes.crs import Mercator, EuroPP, LambertConformal
from cartes.utils.features import countries

from traffic.data.samples import belevingsvlucht


with plt.style.context("traffic"):
    fig = plt.figure()

    # Choose the projection type
    ax0 = fig.add_subplot(131, projection=Mercator())
    ax1 = fig.add_subplot(132, projection=EuroPP())
    ax2 = fig.add_subplot(133, projection=LambertConformal(10, 45))

    for ax in [ax0, ax1, ax2]:
        ax.add_feature(countries())

        ax.set_extent(belevingsvlucht, buffer=1)
        ax.gridlines()
        ax.spines['geo'].set_visible(False)

        belevingsvlucht.plot(ax)
        ax.set_title(ax.projection.__class__.__name__, fontsize=14)

    fig.set_tight_layout(True)
Example with Altair
Note
If you do not specify any projection, altair keeps a Mercator projection by default.
import altair as alt
from cartes.atlas import benelux

alt.data_transformers.disable_max_rows()

base = alt.layer(
    alt.Chart(benelux.topo_feature)
    .mark_geoshape(fill="none", stroke="#bab0ac")
    .transform_filter("datum.properties.ISO2 == 'NL'"),
    belevingsvlucht.geoencode(),
    alt.Chart(
        alt.graticule(extent=((3.1, 50.5), (7.7, 54.2)), step=(1, 0.5))
    ).mark_geoshape(stroke="#bab0ac", strokeWidth=0.5),
).properties(width=200)

chart = (
    alt.hconcat(
        base.project().properties(title="Mercator (default)"),
        base.project(**EuroPP()).properties(title="EuroPP"),
        base.project(**LambertConformal(10, 45)).properties(title="LambertConformal"),
    )
    .configure_view(stroke=None)
    .configure_title(anchor="start", font="Lato", fontSize=16)
)
chart