How to select go-arounds from a set of trajectories?
Go-arounds are situations when, for reasons of safety, stability or after an instruction from ATC, aircraft aligned on a runway interrupt their approach, initiate an overshoot and go around for another attempt to land at the same airport—possibly on a different runway. The change in thrust and go around in trajectory may occur before or after the runway threshold.
The traffic library provides a function to detect go-arounds in trajectories:
- Flight.go_around(airport=None, dataset=None, **kwargs)
Detects go-arounds.
The method yields pieces of trajectories with exactly two landing attempts (aligned on one runway) on the same airport separated by exactly one climbing phase.
- Parameters:
airport (None | str | ‘Airport) – If None, the method tries to guess the landing airport based on the
datasetparameter. (seelanding_airport())dataset (None | ‘Airports) – database of candidate airports, only used if
airportis None
- Return type:
See also: How to select go-arounds from a set of trajectories?
The function returns a FlightIterator as there may be
several go-arounds (i.e. more than two attempts to land) at a given airport.
Let’s illustrate how the library works with this dataset of trajectories landing at Zurich airport over two months in 2019.
from traffic.data.datasets import landing_zurich_2019

subset = landing_zurich_2019.between("2019-10-09", "2019-10-16")
for flight in subset:
    for segment in flight.go_around("LSZH"):
        break
    else:  # https://stackoverflow.com/a/654002/
        continue
    break  # only reachable from nested break
Internally, in order to detect a go around, the library looks at two landing
attempts with aligned_on_ils(), and ensures there is
a climbing phase,
characterising the overshoot, between the two attempts.
import altair as alt

base = (
    segment.phases().chart()
    .encode(
        alt.X(
            "utchoursminutesseconds(timestamp)",
            axis=alt.Axis(format="%H:%M", title=None),
        )
    )
)

alt.vconcat(
    base.encode(alt.Y("phase", title="Flight phase"), alt.Color("phase")).mark_point(),
    base.encode(alt.Y("ILS", title="Runway ILS"), alt.Color("ILS", legend=None))
    .mark_point()
    .transform_filter("datum.ILS==34"),
    base.encode(alt.Y("altitude", title="altitude (in ft)")).properties(height=150),
).resolve_scale(color="independent").configure_legend(title=None).configure_axis(
    titleAngle=0,
    titleY=-15,
    titleX=0,
    titleAnchor="start",
    titleFont="Lato",
    titleFontSize=14,
    labelFontSize=12,
)
flight.map_leaflet(airport="LSZH", zoom=9, highlight=dict(red="go_around('LSZH')"))
Among methods applicable on a FlightIterator, the
has() method returns True if the iterator
is not empty:
flight.go_around("LSZH").has()
True
There is also a has() method available on
Flight objects: it accepts functions returning a
FlightIterator or strings representing a call to a
Flight method:
flight.has('go_around("LSZH")')
True
This helps to stack operations on a LazyTraffic. The
following visualization is an attempt to show whether go-arounds tend to occur
on particular days or times of a day (we could look for a correlation with
weather conditions) or whether they are just sporadic events due to external
factors. To be honest, nothing clear comes out of this one.
import altair as alt

# the desc= argument in eval() creates a progress bar
goarounds = subset.has('go_around("LSZH")').eval(max_workers=4)
summary = goarounds.summary(['callsign', 'registration', 'stop']).eval()

alt.Chart(summary).mark_square(size=100).encode(
    alt.X("utchours(stop):T", title="Hour of day"),
    alt.Y("utcday(stop):T", title="Day of month"),
    alt.Color("count()", title="Number of go-arounds"),
).properties(height=100).configure_legend(orient="bottom")
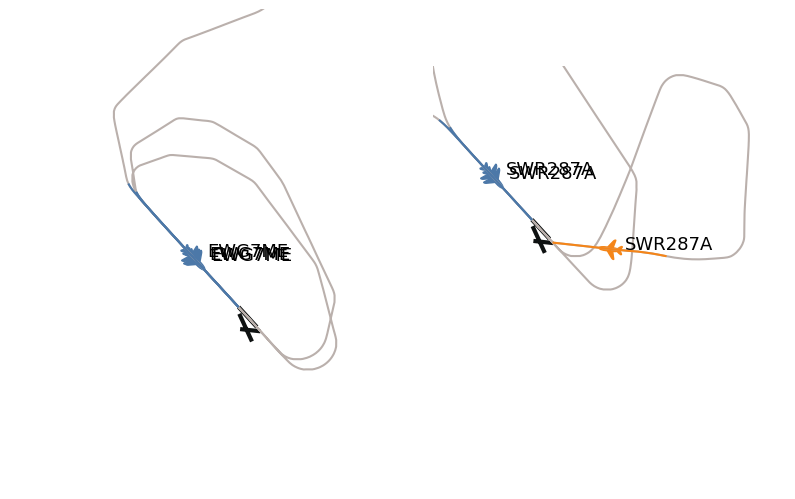
A few aircraft perform several go-arounds before landing. All attempts are not necessarily on the same runway, as exemplified below:
for flight in goarounds:
    if flight.go_around().sum() > 1:
        display(flight)
Flight EWG7ME_1079
- callsign: EWG7ME (EDDL to )
- aircraft:
3c48f0· 🇩🇪 D-ABGP (A319) - start: 2019-10-09 17:36:01+00:00
- stop: 2019-10-09 18:26:18+00:00
- duration: 0 days 00:50:17
- sampling rate: 1 second(s)
Flight SWR287A_10099
- callsign: SWR287A (LEMD to )
- aircraft:
4b17de· 🇨🇭 HB-JBA (BCS1) - start: 2019-10-15 10:05:46+00:00
- stop: 2019-10-15 10:45:31+00:00
- duration: 0 days 00:39:45
- sampling rate: 1 second(s)
import matplotlib.pyplot as plt
from cartes.crs import EuroPP

from traffic.data import airports

with plt.style.context("traffic"):
    fig, ax = plt.subplots(1, 2, subplot_kw=dict(projection=EuroPP()))

    idx = 0
    for flight in goarounds:
        if flight.go_around().sum() > 1:
            airports["LSZH"].plot(ax[idx], footprint=False, runways=True)
            flight.plot(ax[idx], color="#bab0ac")
            for segment in flight.aligned_on_ils("LSZH"):
                res, *_ = segment.plot(
                    ax[idx],
                    lw=1.5,
                    color="#4c78a8" if segment.ILS_max == "14" else "#f58518",
                )
                segment.at_ratio(0.5).plot(ax[idx], color=res.get_color())

            ax[idx].set_extent(segment, buffer=0.2)

            idx += 1
Here, we somehow broke the principle of separation between visualization and trajectory processing. It is actually possible to create a collection of trajectories with more than one go around (more than 2 landing attempts):
either with the
from_flights()class method;or by creating a custom function and stacking it with the
pipe()operator
def many_goaround(flight: 'Flight') -> bool:
    return flight.go_around("LSZH").sum() > 1

goarounds.iterate_lazy().pipe(many_goaround).eval()
Traffic
with 2 identifiers| count | |
|---|---|
| flight_id | |
| EWG7ME_1079 | 3018 |
| SWR287A_10099 | 2386 |
In the following example, we try to look at possible contributing factors leading to many go-arounds for one of the identified situations, which includes a runway configuration change:
bars behind aircraft represent the duration of the final approach (aligned with ILS);
the colour of the trail represents the number of landing attempts;
the runway configuration change suggests possible tail or cross wind conditions which are well-known contributing factors for go-arounds.
data = (
    landing_zurich_2019.between("2019-10-15 10:10", "2019-10-15 10:50")
    .all("aligned_on_LSZH", flight_id="{self.callsign}_{i}")
    .summary(["callsign", "ILS_max", "start", "stop"])
    .eval()
    .rename(columns=dict(start="final approach", stop="landing"))
)

base = alt.Chart(
    # add one column in the table to count the landing attempts
    data.merge(
        data.groupby("callsign")["landing"].count().rename("landing attempts"),
        left_on="callsign",
        right_index=True,
    )
)

chart = (
    (
        base.mark_rule(size=3, opacity=0.5).encode(
            alt.X(
                "utchoursminutes(final approach)",
                axis=alt.Axis(title=""),
            ),
            alt.X2("utchoursminutes(landing)"),
            alt.Y("landing:N", sort="-x", axis=None),
            alt.Color("landing attempts:N"),
        )
        + base.mark_text(baseline="middle", align="left", dx=12).encode(
            alt.X("utchoursminutes(landing)"),
            alt.Y("landing:N"),
            alt.Text("callsign"),
            alt.Color("landing attempts:N"),
        )
        + base.mark_text(baseline="middle", align="left", size=25, dy=1, dx=-8).encode(
            alt.X("utchoursminutes(landing)"),
            alt.Y("landing:N"),
            alt.Color("landing attempts:N", title="Number of landing attempts"),
            text=alt.value("✈"),
        )
    )
    .properties(width=600, height=150)
    .facet(row="ILS_max")
    .configure_axis(labelFontSize=14)
    .configure_header(
        labelFontSize=24,
        labelFont="Ubuntu",
        labelOrient="right",
        labelAngle=90,
        labelPadding=-100,
        title=None,
    )
    .configure_legend(orient="bottom", labelFontSize=13, titleFontSize=13)
    .configure_text(font="Ubuntu")
    .resolve_axis(y="independent")
)

chart