Sun elevation along a flight
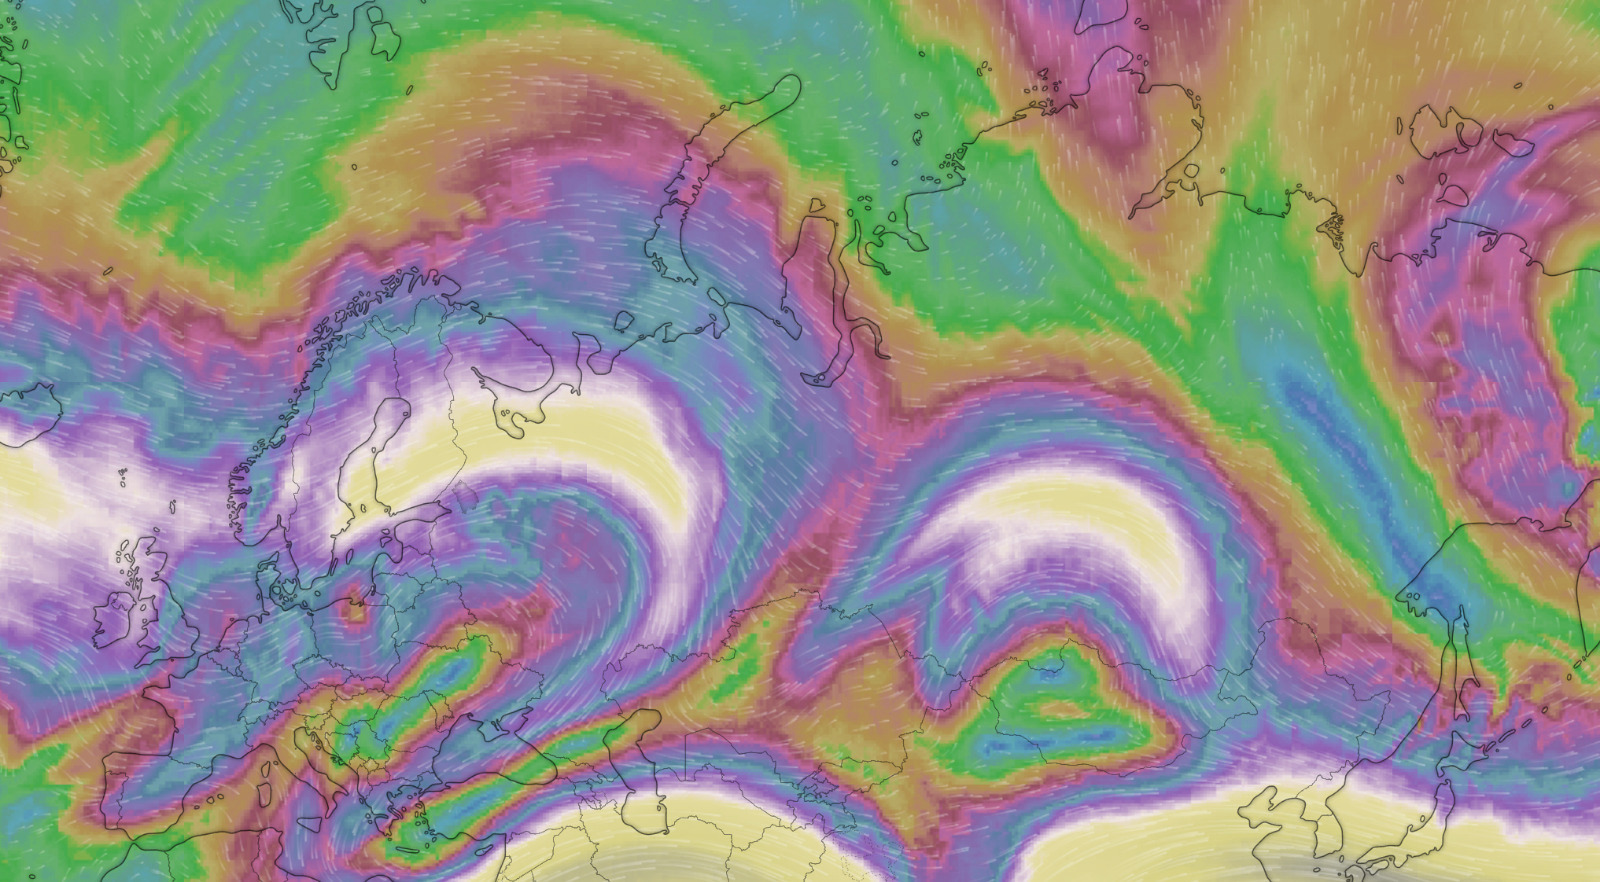
Flight AF291 from Kansai airport (RJBB) to Paris (LFPG) on January 3rd 2020 was flying quite higher than usual in latitude because of strong headwinds on the usual route over Finland and the White Sea. See for reference the following screenshot image from windy.com taken on that day.
The usual route departs before noon from Japan and reaches Paris in the middle of the afternoon, a twelve hour flight which feels like noon-ish all along.
When we fly these latitudes (up to 77°, i.e. 11 degrees North of the Arctic circle would) close the winter solstice, we experience at some point the Arctic night.
import altair as alt

(
    f.assign(arctic_circle=66.5)
    .chart("latitude", "arctic_circle")
    .encode(
        alt.Color("variable", legend=alt.Legend(title="angle")),
    )
    .properties(height=180, width=400)
)
The astropy library contains all you need to compute the relative positions of astral bodies. A common use case is to calculate the position of stars or satellites from a given position on Earth. A fun thing to do with aircraft here would be to compute the elevation (altitude, in angle) of the sun with respect to the aircraft. The timestamp will help computing the position of the Sun, before we calculate the altitude and azimuth angles from the three-coordinate position (latitude, longitude, altitude) of the aircraft.
import pandas as pd

from astropy.coordinates import get_sun, AltAz, EarthLocation
from astropy.time import Time

# use astropy to compute the position of the Sun w.r.t the aircraft

time = Time(f.data.timestamp)
sun_position = get_sun(time)
aircraft_position = EarthLocation(
    lat=f.data.latitude.values,
    lon=f.data.longitude.values,
    height=f.data.altitude.values * 0.3048,  # convert to meter
)
aircraft_frame = AltAz(obstime=time, location=aircraft_position)
sun_altaz = sun_position.transform_to(aircraft_frame)

# include sun altitude and azimuth in the flight data

df = pd.DataFrame(
    dict(
        timestamp=f.data.timestamp,
        sun_altitude=list(x.value for x in sun_altaz.alt),
        sun_azimuth=list(x.value for x in sun_altaz.az),
    )
)

g = f.merge(df, on="timestamp")
(
    g.assign(horizon=0, twilight=-6)
    .chart("sun_altitude", "horizon", "twilight")
    .encode(
        alt.Color(
            "variable",
            legend=alt.Legend(title="angle"),
            scale=alt.Scale(
                domain=["sun_altitude", "horizon", "twilight"],
                range=["#eeba30", "#5a73ce", "#372e29"],
            ),
        ),
    )
    .properties(height=180, width=400)
)
We usually consider it twilight when the Sun is between 0° and -6° below the horizon: the sky is still quite bright. In this particular situation, information from outside is pretty confusing: we fly westbound, never far from the terminator, local time is always around noon, the Sun goes under the horizon for few hours without really disappearing. It is dark but never really night.
The next step is to plot the trajectory with different colors:
- yellow (■ #eeba30) during day time (sun above the horizon);
- orange (■ #dc6900) when the sun is just below the horizon (from 0° to -6°);
- red (■ #ae0001) when the sun is between -6° and -10° below the horizon;
- black (■ #372e29) when the sun is the lowest.
from ipyleaflet import Map, basemaps
from ipywidgets import Layout

map_ = Map(
    center=(60, 80),
    zoom=2,
    layout=Layout(height="500px", max_width="500px"),
    basemap=basemaps.CartoDB.Positron,
)

map_.add_layer(g, color="#eeba30")  # yellow
map_.add_layer(g.query("sun_altitude < 0"), color="#dc6900")  # orange
map_.add_layer(g.query("sun_altitude < -6"), color="#ae0001")  # red
map_.add_layer(g.query("sun_altitude < -10"), color="#372e29")  # black

map_
Now comes the fun when you have a window seat toward the sun: you take pictures!
Using the timestamp in the EXIF information of each image, you may place a marker on a map and get an idea of how far the Sun is below the horizon, with a reference based on the color of the trajectory (yellow for daylight, orange for twilight, etc.)
import re

import cv2
import exifread

from ipywidgets import Image, Layout
from ipyleaflet import Popup

# for each JPG file in the folder (a pathlib.Path)

for file in sorted(list(picture_directory.glob("**/*.JPG"))):
    with file.open("rb") as fh:

        # parse EXIF information
        exif_tags = exifread.process_file(fh)
        s = exif_tags["EXIF DateTimeDigitized"].values

        # Parse time and correct the timestamp of your device (+01:00 for mine)
        ts = pd.Timestamp(re.sub(r"(\d+):(\d+):(\d+) ", r"\1/\2/\3 ", s) + "+01:00")

        # safeguard, the picture must have been taken during the flight
        assert f.start <= ts <= f.stop

        # read the image
        img = cv2.imread(file.as_posix())

        # resize the image
        scale = 0.1
        width = int(img.shape[1] * scale)
        height = int(img.shape[0] * scale)
        dim = (width, height)
        resized = cv2.resize(img, dim, interpolation=cv2.INTER_AREA)
        _, arr = cv2.imencode(".jpg", resized)

        # build an Image to place on the map
        image = Image(value=arr.tobytes(), layout=Layout(min_width="200px"))

        point = f.before(ts).at()
        marker = point.leaflet(title=f"{ts}", draggable=False)
        marker.popup = image

        map_.add_layer(marker)